

Computer Science Projects:
- Quincy Mutual Group: Actuarial Product Intern Summer 2026
- Over the summer, I had an internship at Quincy Mutual Group as an actuarial product intern. I helped the actuarial team create interactive Power BI dashboards: Personal Auto Metrics Dashboard and a Homeowners Retention Dashboard to communicate business performance and retention trends. I used SQL to build and structure datasets for interactive, informative graphs, and visuals. Additionally, I had the opportunity to work on a capstone project with my fellow interns focused on how the company can improve its use of Microsoft Copilot. We identified multiple use cases across different departments to explore how Copilot could benefit their specific workflows, while also thinking about the challenges and limitations of implementing it. We concluded the project by writing a final report and presenting our findings and recommendations to the company. Through these projects, I strengthened my technical and data analytics skills while gaining hands-on experience with data visualization and learning how data can be transformed into meaningful insights to support business and actuarial decision making.
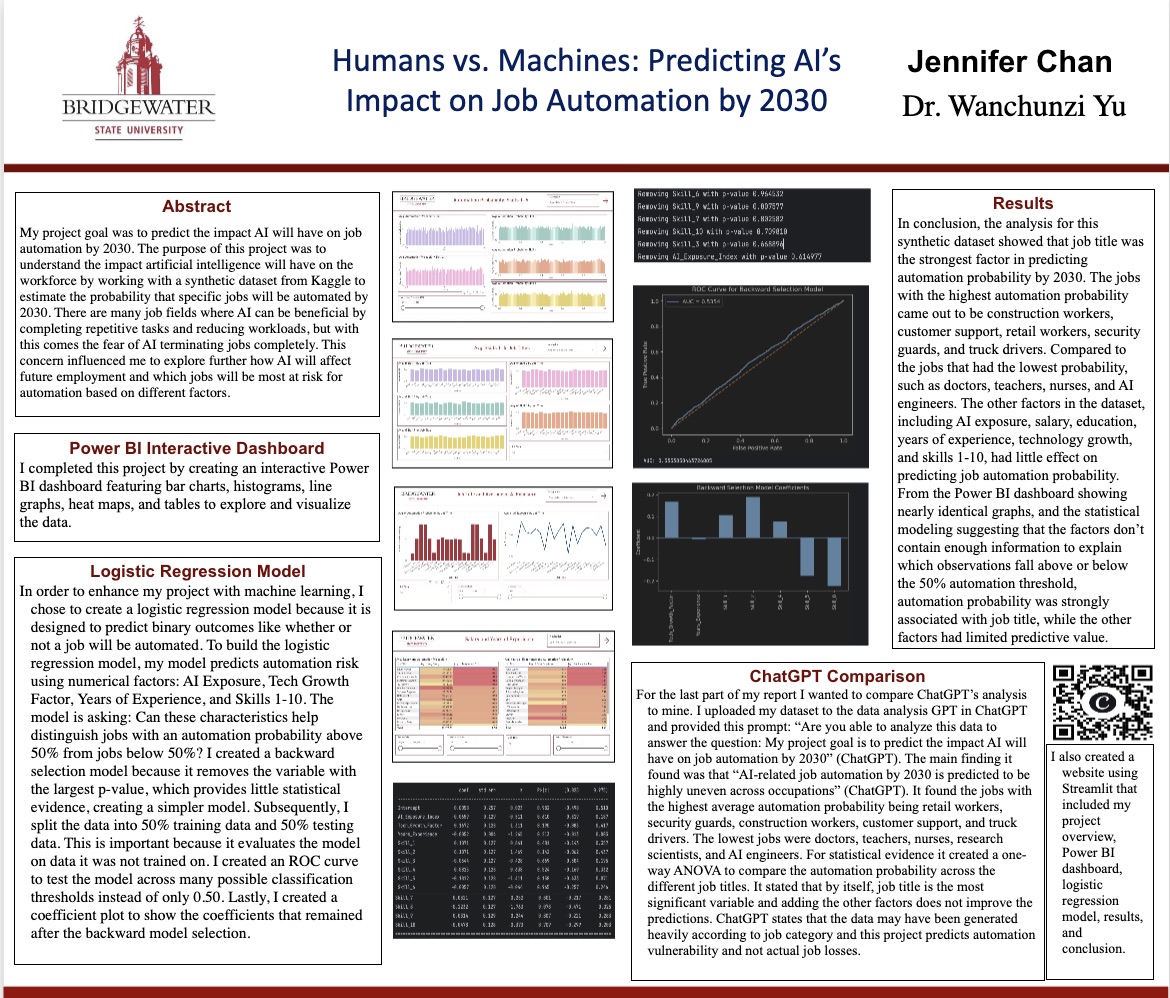
- ATP Undergraduate Research Project: Humans vs. Machines: Predicting AI’s Impact on Job Automation by 2030
- My project goal was to predict the impact AI will have on job automation by 2030. The purpose of this project was to understand the impact artificial intelligence will have on the workforce by working with a synthetic dataset from Kaggle to estimate the probability that specific jobs will be automated by 2030. I completed this project by creating an interactive Power BI dashboard featuring bar charts, histograms, line graphs, heat maps, and tables to explore and visualize the data. I also created a logisitic regression model to predict automation risk using numerical factors. I created a backwards selection model, an ROC curve to test the model across possible classification thresholds, and lastly I created a coefficient plot to show the coefficients that remained after the backward model selection. For the last part of my report, I wanted to compare ChatGPT's analysis to mine, so I uploaded the dataset to the data analysis GPT in ChatGPT. It stated that by itself, job title is the most significant variable and adding the other factors does not improve the predictions. ChatGPT states that the data may have been generated heavily according to job category and this project predicts automation vulnerability and not actual job losses. I collaborated with a faculty mentor to complete this project and I presented these findings at a symposium.
- Software Engineering: Java-based Food Delivery System
- I collaborated on a semester-long team project to develop a Java-based Food Delivery System modeled after actual food delivery apps. I created interaction and structural models, system architecture, UI design, and UI wireframes. I also conducted testing to ensure order functionality. This project allowed us to think critically about system design and user usability, and it also enhanced my collaborative skills.
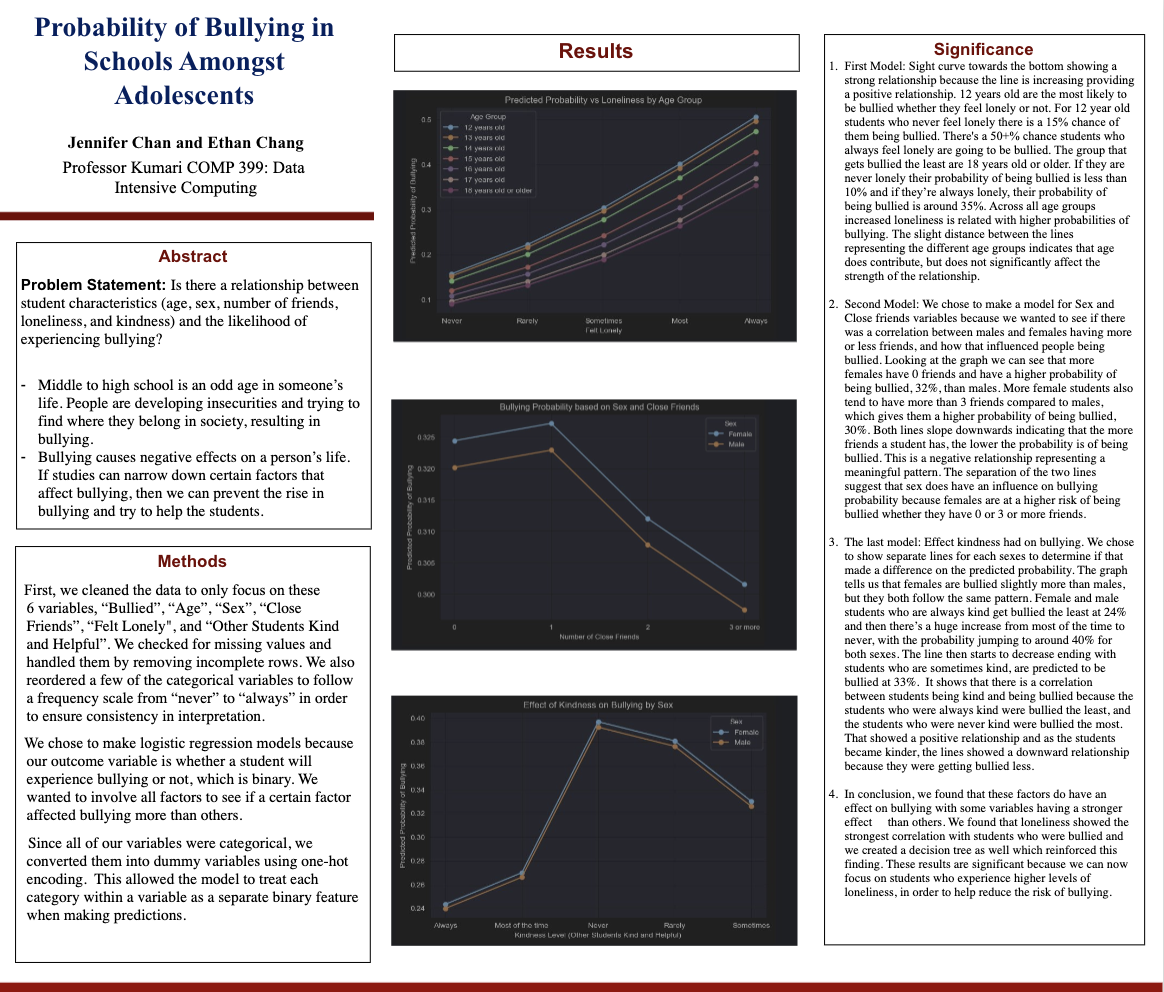
- Data Intensive Computing: Probability of Bullying in Schools Amongst Adolescents
- I completed a projects on bullying in Data Intensive Computing during the Spring 2026 semester. My Problem Statement was: Is there a relationship between student characteristics (age, sex, number of friends, loneliness, and kindness) and the likelihood of experiencing bullying? I completed data cleaning to check for missing and duplicate values. I made a couple of logisitic regression models by converting the categorical variables to dummy variables using one-hot encoding. I found that loneliness showed the strongest correlation with students who were bullied and I also created a decision tree to reinforce that finding.
- Data Analytics Certification
-
Data visualization Course
- I independently completed a final report analyzing a final exam score dataset. I used Excel and Tableau to create scatter plots, bar graphs, linear regression visualizations, and interactive dashboards.
-
Intro to Software Data Analytics Course
- I independently completed a final report analyzing an NBA Finals dataset. I used Python and Power BI to create histograms, bar charts, stacked bar graphs, and interactive dashboards.
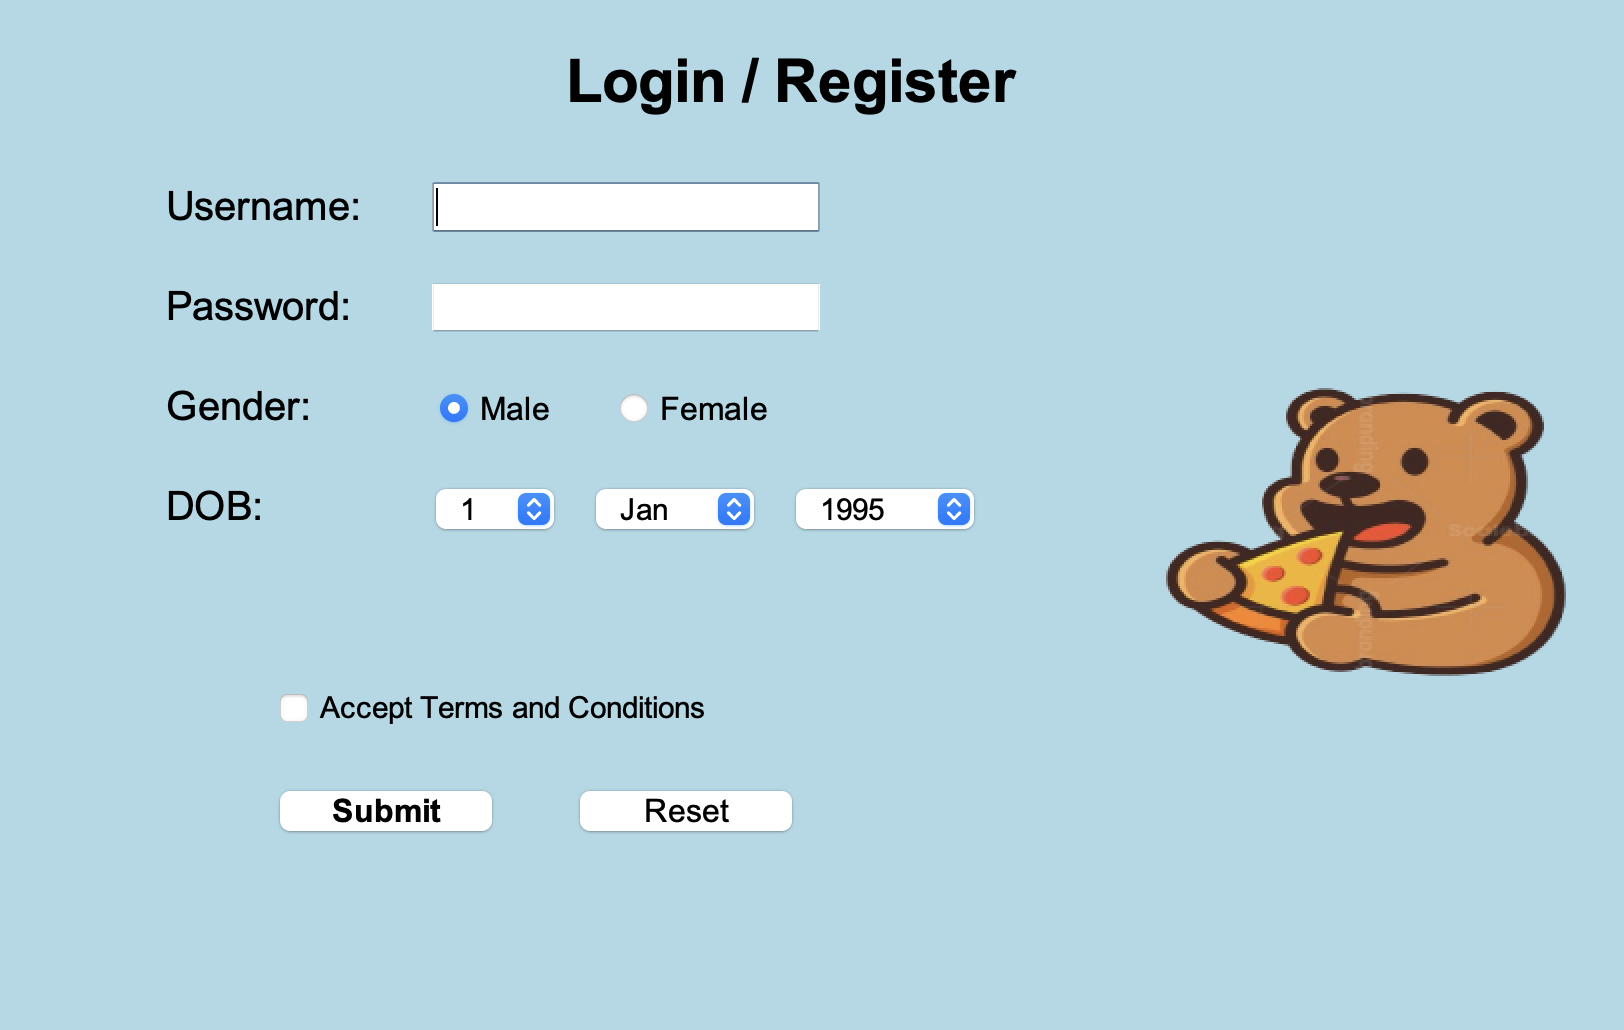
COMP335 final group project idea:
For our final project, Lily and I will be making a website about music recommendations. We were thinking about doing mood recommendations where users can choose between different moods and we will recommend songs based on that. Another option we were thinking about was having the user pick a genre, and we will recommend songs based on the genre picked.